


From Data to Direction: How Institutional Research Helps Solve Student Retention Challenges
Universities regularly face strategic questions for which there is no immediate or obvious answer. Student retention is one such challenge. If fewer students return for their second year, the problem may appear straightforward: students are leaving, so the university needs to improve retention. However, before deciding what to do, a more important question needs to be understood.
Why are students leaving?
The answer cannot be found in a single number.
A university may know its overall retention rate. However, that figure alone does not reveal which students are leaving, when they are leaving, or what factors may be associated with their decision to leave. Addressing the problem therefore requires moving beyond reporting numbers to investigate what those numbers are telling us.
This is where institutional research can support strategic planning.
About the Example
The discussion that follows uses a fictional example to illustrate the process. The university, programme names, student numbers, retention rates, trends, and other data presented in the example are created solely for the purpose of building a realistic story around a student retention problem. They should not be interpreted as representing any particular university or actual institutional data.
The analytical process presented is also a suggested approach rather than a fixed plan. In practice, the steps taken by an institutional research or data analytics team may differ depending on the nature of the problem, the questions being asked, the data available, and the institutional context. The purpose of this example is not to prescribe a single method, but to illustrate an important principle: a problem should be understood carefully before an institution sets out to solve it.
To see how, consider the work of a data analyst at a university that has identified a decline in first-year student retention. Rather than immediately recommending a solution, the analyst begins by investigating the problem step by step.
The Problem: Retention Is Declining
The university's leadership team notices that the proportion of students returning for their second year has been declining over several academic years.
The first task for the data analyst is to establish whether this is a temporary fluctuation or a sustained trend.
The analyst examines the university's first-year retention rate over five years:
Table 1. First-Year Retention Rate by Academic Year
Academic Year | New Students | Students Returning | Retention Rate |
2020-21 | 1000 | 910 | 91% |
2021-22 | 1050 | 935 | 89% |
2022-23 | 1100 | 946 | 86% |
2023-24 | 1120 | 952 | 85% |
2024-25 | 1150 | 943 | 82% |
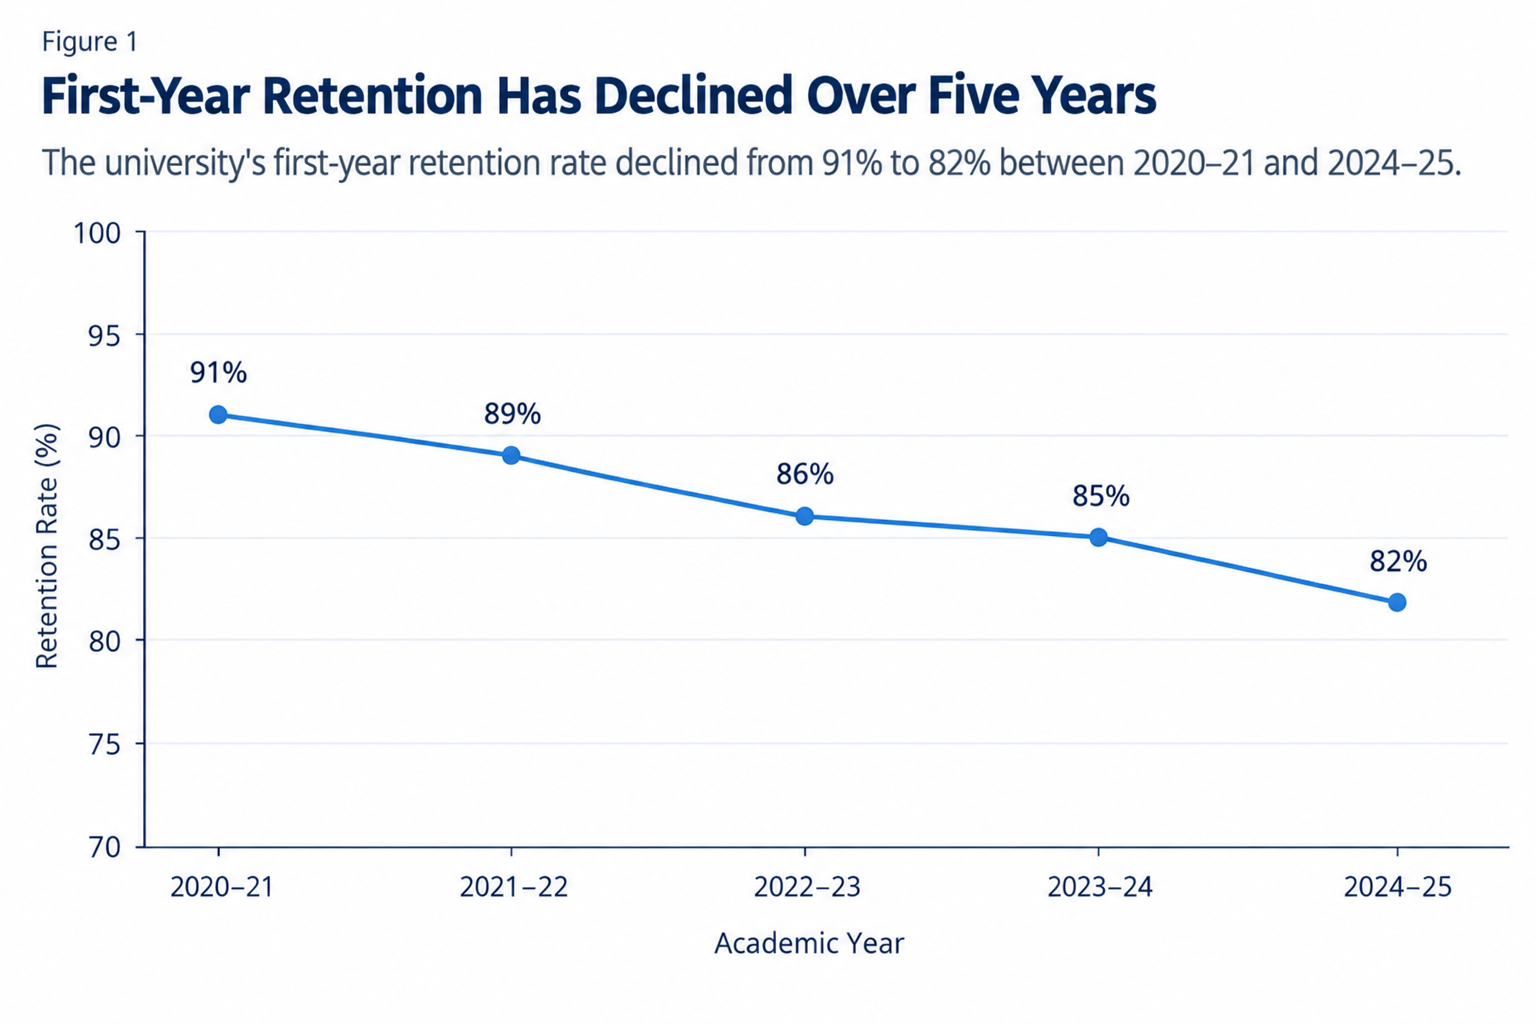
The data immediately reveals a pattern. The university's retention rate has fallen from 91% to 82% over five years. However, the analyst does not stop at the overall figure. The trend establishes that there is a problem, but it does not explain why the problem is occurring.
The next question therefore is: Is the decline happening across the university, or is it concentrated in programmes or groups of students?
Looking Beneath the Overall Retention Rate
An institutional average can conceal substantial differences between programmes. The analyst therefore disaggregates the retention data by academic programme.
Table 2. Retention Rate by Academic Programme
Programme | 2020-21 | 2024-25 | Change |
Business | 92% | 90% | -2% |
Computer Science | 93% | 88% | -5% |
Social Sciences | 90% | 84% | -6% |
Engineering | 91% | 80% | -11% |
Humanities | 89% | 79% | -10% |
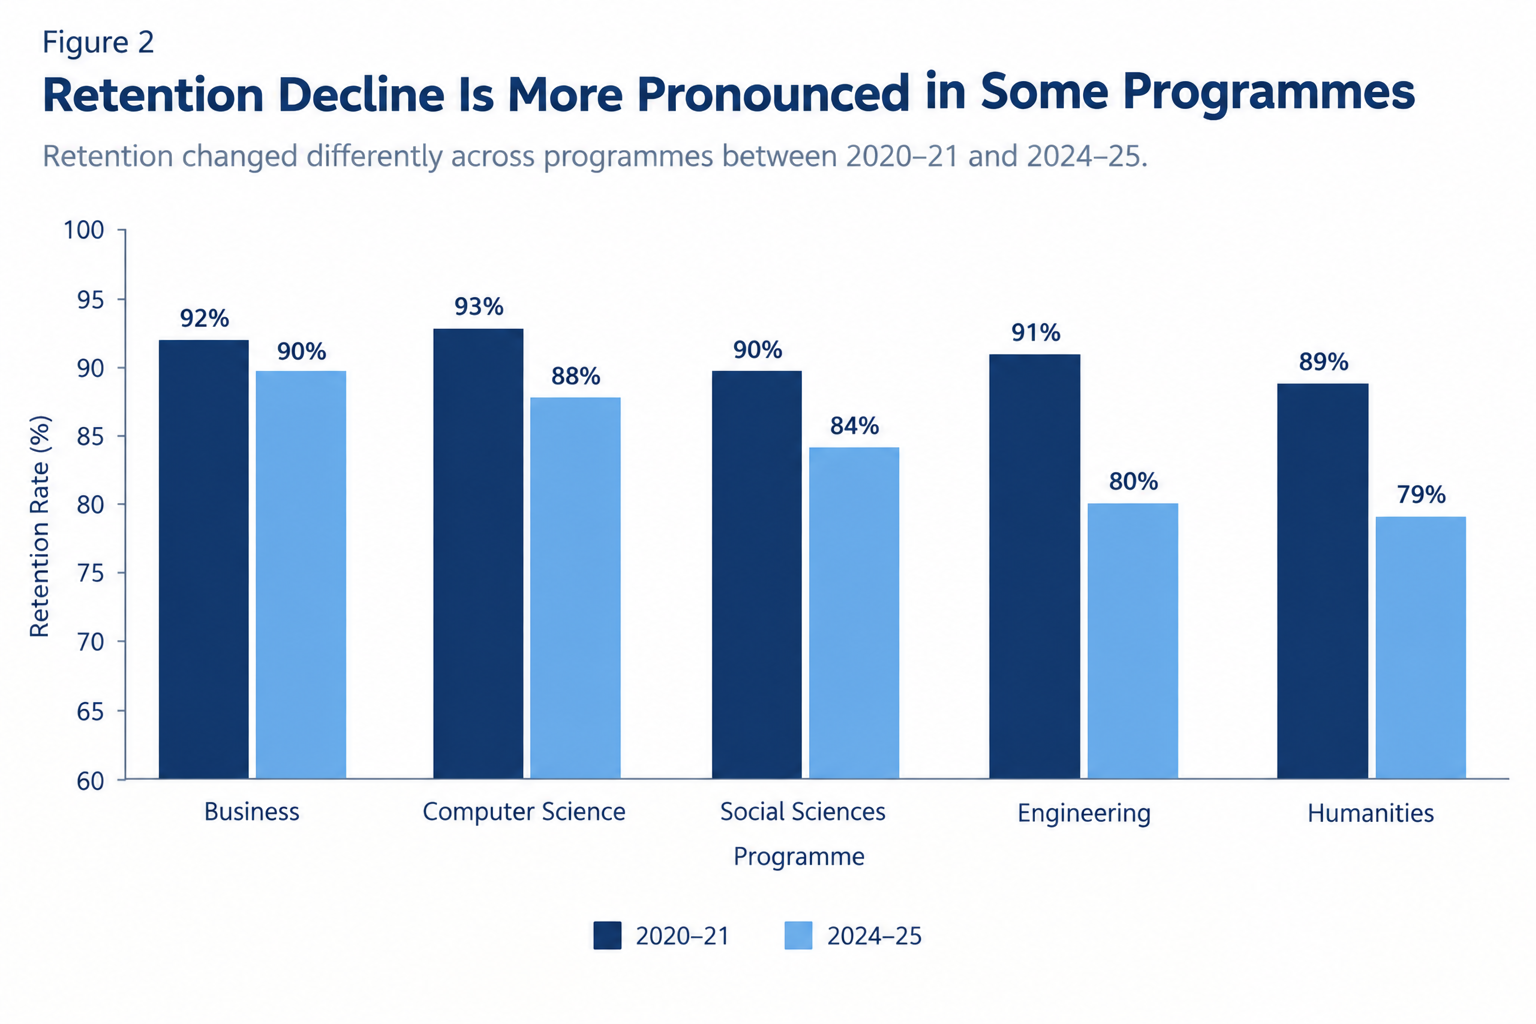
The analysis provides a new perspective. The decline is not evenly distributed. Business has remained relatively stable, while Engineering and Humanities have experienced much larger decreases.
This changes the question the analyst needs to answer. Instead of asking: Why is the university’s retention rate declining? The analyst can now ask: Why are students in particular programmes experiencing lower retention?
This is an important stage in institutional research. Disaggregating data allows a broad institutional problem to become a more focused and potentially actionable one. However, programme-level differences still do not explain when students are leaving.
When Are Students Leaving?
The analyst's next step is to examine the timing of attrition. If students are leaving throughout their degree, the university may need a broad retention strategy. If most students are leaving during their first year, the institution may need to focus its attention on the transition into university and the early student experience.
The analyst examines the first-year student journey and finds the following pattern:
Table 3. Student Retention Across the First Year
Stage | Students Remaining |
Start of First Semester | 100% |
End of First Semester | 94% |
Start of Second Semester | 93% |
End of First Year | 82% |
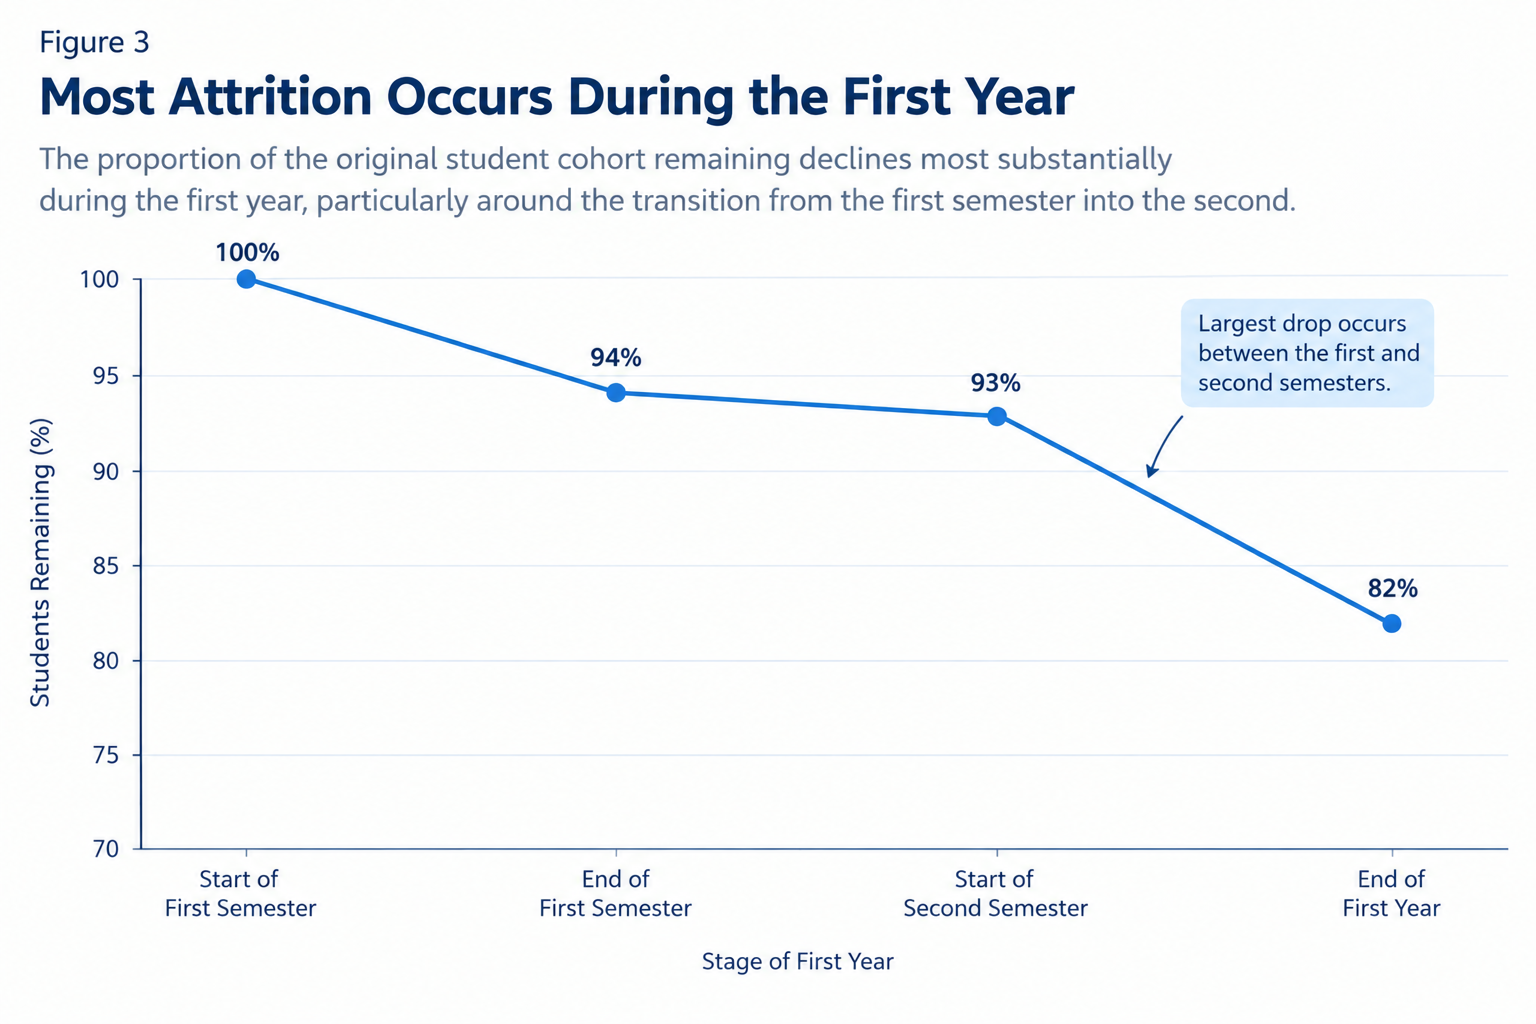
The largest decline occurs during the first year, with the most noticeable drop occurring around the transition from the first semester into the second. The problem has now become more clearly defined. The university is not simply facing a general retention issue. The evidence suggests that:
- Retention has declined over several years;
- The decline is more pronounced in some programmes than others; and
- A substantial proportion of attrition occurs during the first year.
The analyst can therefore move to the next question: What is happening to students during their first year that may be contributing to their decision to leave?
Connecting Different Sources of Data
Retention data tells the analyst what is happening. To understand what may be contributing to the pattern, the analyst needs to examine other sources of institutional information. The investigation brings together several datasets, including:
- Student academic performance
- Course-level grades
- Course withdrawal and failure rates
- Student survey responses
- Academic advising records
- Financial-aid information
- Student engagement with academic support
- Reasons provided by students who withdrew
The purpose is not to search for one variable that explains everything. Instead, the analyst looks for patterns across different sources of evidence. Several patterns begin to emerge.
Students who leave university are more likely to have experienced academic difficulties during their first semester. The analysis also identifies a small number of introductory courses with significantly higher withdrawal and failure rates than other courses. Student survey responses provide another piece of the picture. A considerable proportion of students who later leave report difficulty understanding where to seek academic assistance when they encounter problems. Financial concerns also appear frequently among the reasons students provide for withdrawal.
At this stage, the analyst has identified several factors associated with the retention problem. However, an important analytical principle must be maintained: association is not the same as causation. For example, if students with lower first-semester GPAs are more likely to leave, that does not automatically mean that low grades caused them to leave. Academic performance may be connected to other academic, financial, or personal circumstances.
The purpose of institutional research is therefore not to turn every observed relationship into a causal conclusion. Instead, these patterns help identify where the university should investigate further and where targeted interventions may be appropriate.
From Analysis to Diagnosis
The investigation can now be brought together. The initial question was: Why is retention declining? The analysis has progressively refined the problem:
Retention is declining → the decline is concentrated in programmes → much of the attrition occurs during the first year → academic difficulty, challenging courses, limited engagement with support, and financial concerns appear among the factors associated with students leaving.
The data has transformed a broad institutional concern into a set of more specific issues that can be addressed. This is the point at which institutional research begins to connect directly with strategic planning. The university can now ask: What actions should we take in response to what we have learned?
Developing a Response
The findings suggest that a single intervention is unlikely to address every aspect of the problem. Instead, the university develops a set of targeted strategies that correspond to the issues identified through the analysis.
- Identify Academic Difficulties Earlier:
The analysis shows that students experiencing academic difficulties early in their first semester are more likely to leave. Rather than waiting until the end of the semester to identify struggling students, the university can establish an early-alert mechanism. Early indicators might include poor performance in initial assessments, repeated missed assessments, declining engagement, or other appropriate academic indicators.
The objective is not to label students. It is to identify students who may benefit from timely support. Academic advisors and relevant support units can then reach out to students before their difficulties become more difficult to address.
- Examine High-Withdrawal Courses:
The analysis identifies several introductory courses with unusually high withdrawal and failure rates. Rather than assuming that these courses are responsible for the overall retention problem, the university can conduct a deeper course-level review. This review could be examined:
- Assessment patterns
- Course prerequisites
- Curriculum sequencing
- Workload
- Student feedback
- Teaching and learning practices
- Academic support available to students
The objective is to determine whether there are structural or instructional factors that could be addressed while maintaining the academic standards of the programme.
- Strengthen Proactive Academic Advising:
Survey responses indicate that some students experiencing difficulties are unsure where to seek help. The university can therefore strengthen its advising model by making outreach more proactive. Instead of relying entirely on students to initiate contact, advisors can reach out to students identified through appropriate early indicators and connect them with academic, wellbeing, financial, or other support services as needed.
- Examine Financial Barriers:
Financial concerns also appear among the reasons provided by students who withdraw. The university can investigate whether students are aware of existing financial support and whether the available mechanisms adequately address the types of financial challenges students are experiencing. This may lead to changes in communication, outreach, financial-support processes, or other institutional mechanisms.
The important point is that these strategies emerge from the investigation of the problem rather than being selected before the evidence is examined.
From Strategic Decision to Strategic Action
At this stage, the university has moved from identifying a problem to developing a response. However, strategic planning does not end when a strategy is approved. A strategic objective needs to be translated into measurable action. For example:
Table 4. Strategic Objective, Actions, Indicators, and Targets
Strategic Objective | Action | Indicator | Baseline | Target |
Improve first-year retention | Introducing early academic alerts | Students receiving timely intervention | - | 90% |
Improve academic progression | Review of high-withdrawal courses | Target courses reviewed | 0 | 5 |
Strengthen student support | Increase proactive advising | At-risk students contacted | - | 95% |
Improve retention | Monitor first-year retention | Retention rate | 82% | 88% |
This creates a connection between the strategic plan and implementation. The university is no longer simply stating that it wants to “improve retention.” It has identified actions, indicators, a baseline, and a target that can be monitored over time.
Did the Strategy Work?
The data analyst's role does not end when recommendations are implemented. The university continues to monitor subsequent student cohorts.
Following the implementation of early academic alerts, proactive advising, and the review of selected high-withdrawal courses, the retention trend changes:
Table 5. Retention Before and After Intervention
Cohort | Retention Rate |
Before intervention | 82% |
Year 1 after intervention | 85% |
Year 2 after intervention | 88% |
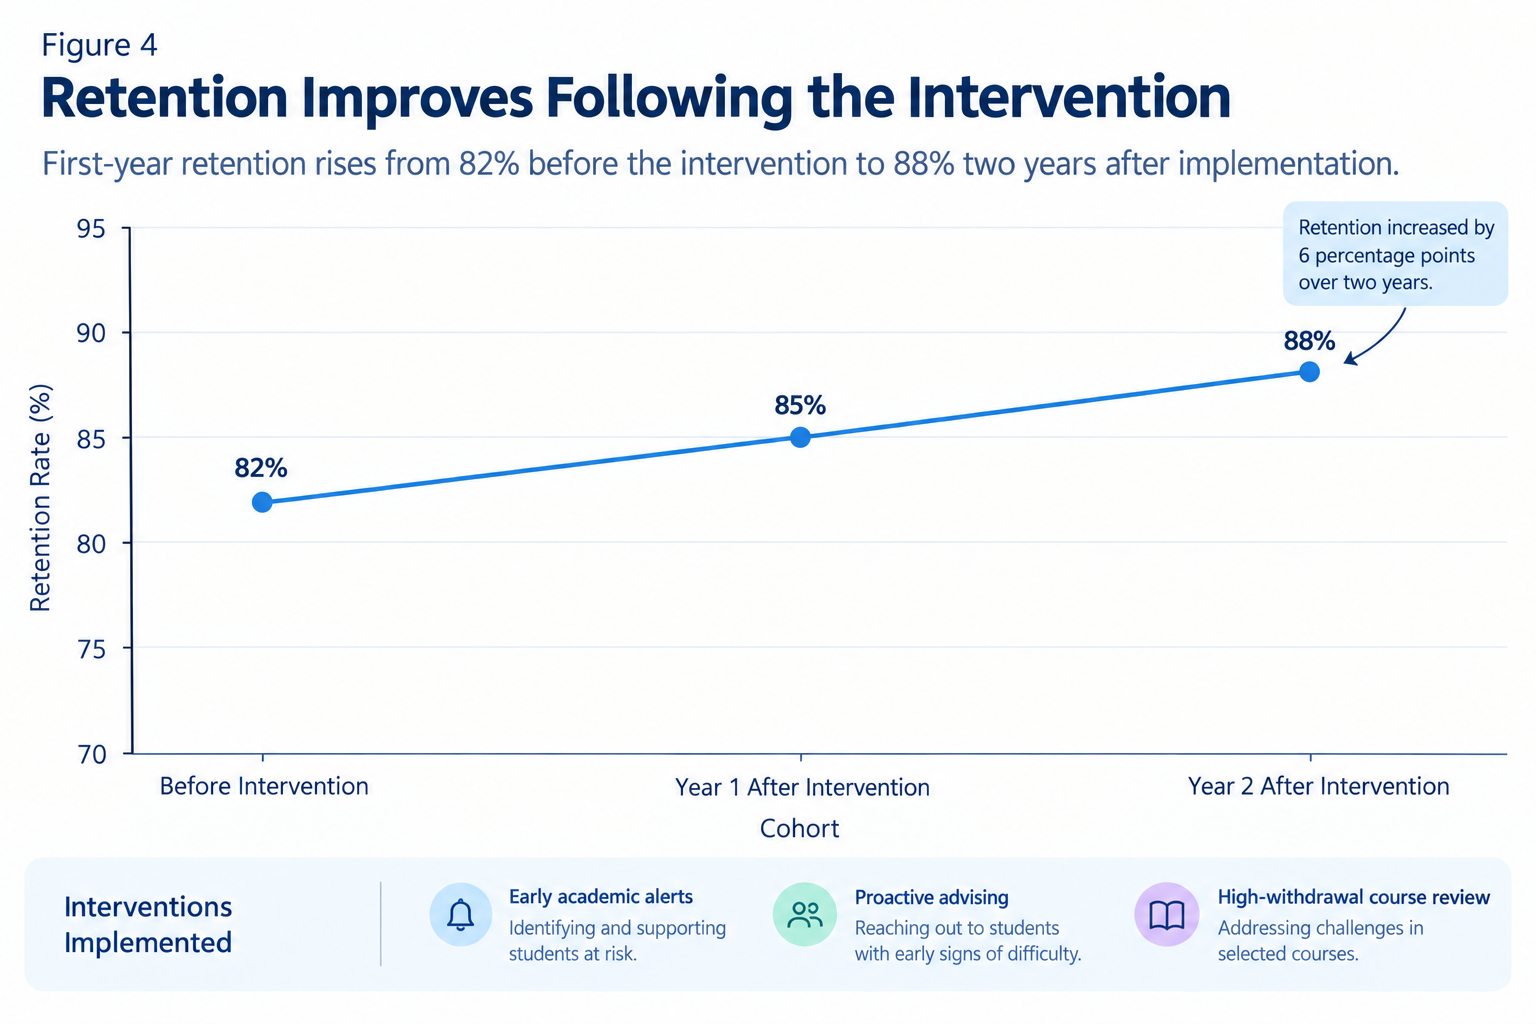
The increase provides an encouraging signal. However, the analyst again exercises caution. An increase in retention after an intervention does not automatically prove that the intervention caused the improvement. Other institutional or external factors may have changed during the same period. The analyst therefore continues to monitor the data.
- Are improvements occurring in the programmes that previously experienced the largest declines?
- Are fewer students leaving after their first semester?
- Are students who receive early support more likely to continue?
- Have withdrawal rates in the reviewed courses changed?
- Are students reporting improved access to academic support?
These questions allow the university to evaluate not only whether the overall indicator has improved, but also whether the underlying patterns identified during the original investigation have changed.
Closing the Loop
The retention case demonstrates a continuous cycle of institutional research and strategic planning:
Identify → Investigate → Understand → Plan → Act → Monitor → Evaluate → Improve
The process begins with a problem, not a solution. The data analyst first establishes the trend. The problem is then broken down by programme and timing to identify where the issue is concentrated. Different sources of institutional data are brought together to investigate possible contributing factors. The findings are then translated into targeted strategies, which are implemented and monitored.
This cycle can also be viewed as a progression:
- Data tells us what is happening.
- Analysis helps us understand the pattern.
- Evidence helps us determine where to act.
- Strategic planning translates insight into priorities and actions.
- Evaluation tells us whether those actions are making a difference.
This is where institutional research becomes more than a reporting function.
Institutional Research as a Strategic Function
Universities generate large amounts of data, but data alone does not create strategic direction. The value of institutional research lies in its ability to help institutions ask the right questions, examine evidence from different perspectives, identify meaningful patterns, and connect those findings to decisions.
In the retention example, the university could have responded to an 82% retention rate by simply setting a target of 88%. Instead, the analytical process revealed a more useful story. The decline was not evenly distributed. Some programmes were more affected than others. Much of the attrition occurred during the first year. Academic performance, course-level patterns, student support, and financial concerns provided areas for further investigation. These findings informed targeted actions that could then be monitored and evaluated.
The difference is significant.
A dashboard can tell an institution that retention is 82%. Institutional research can help the institution understand what that number means and what questions should come next.
Ultimately, effective institutional research is not about having more data. It is about using data to move from problem identification to understanding, from understanding to action, and from action to measurable improvement. The journey from data to direction begins with a question. It continues until the institution can determine not only what is happening, but what it can do about it and whether its actions are making a difference.
Note: AI tools were used to help refine grammar and improve readability in this blog.

The author works as a Program Associate at OPE and has proficiency in statistical and data analysis. He holds a degree in Statistics with minors in Accounting, Finance, and Mathematics. He also freelances on data analysis projects, provides beta reading services, and offers gaming assistance in Minecraft.