A Beginner's Guide to Power BI (Part 3): Performing Calculations for Enhanced Insights
Welcome back to the next phase of your Power BI journey! In this blog, we’ll be exploring essential calculation techniques to help you get the most out of your data. You’ll learn to perform a range of basic calculations, including arithmetic functions, summary statistics, ratios and percentages, and rounding values. Additionally, we’ll cover date functions, calculating date differences, and using simple and nested IF conditions. These foundational skills will allow you to create more precise and informative reports, giving you the power to analyze data from new perspectives. Let’s dive in and enhance your analytical capabilities in Power BI!
There are a number of calculations you can perform in a new column or as a measure using DAX formulas. Calculations can be performed by going to the ‘Calculations’ tab in ‘Table view’ in Power BI.
In the ‘column calculations’, you need to add a new column in order to perform calculations which remains the same once calculated. On the other hand, ‘measures’ are calculated in a similar way but these are mostly used to calculate statistics from the variables and it changes as the data change.
Here are the type of calculations we will discuss in this in this blog post:
1. Arithmetic Functions
a. Addition
b. Difference
c. Product
d. Division
2. Summary Stats
a. Mean
b. Median
c. Min
d. Max
e. Count
f. Distinct count
3. Ratios and Percentages
4. Rounding-off values
5. Date functions
a. Addition in date
b. Difference in date
6. IF conditions
a. Single
b. Nested
Arithmetic Functions
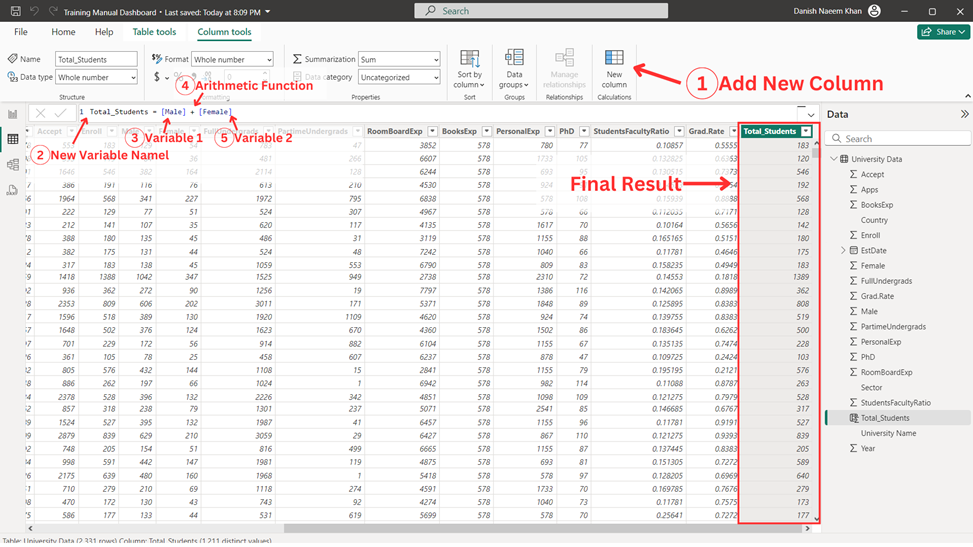
We can calculate the arithmetic functions below with the help of a simple formula.
To calculate arithmetic functions, follow the steps indicated below.
1. Add ‘New Column’.
2. Type new variable name.
3. Type variable 1.
4. Type arithmetic function.
5. Type variable 2.
6. Press enter.
In general, the syntax looks something like this:
Addition
1 New Variable Name = [Variable 1]+[Variable 2]
Difference
1 New Variable Name = [Variable 1]-[Variable 2]
Product
1 New Variable Name = [Variable 1]*[Variable 2]
Division
1 New Variable Name = [Variable 1]/[Variable 2]
Summary Stats
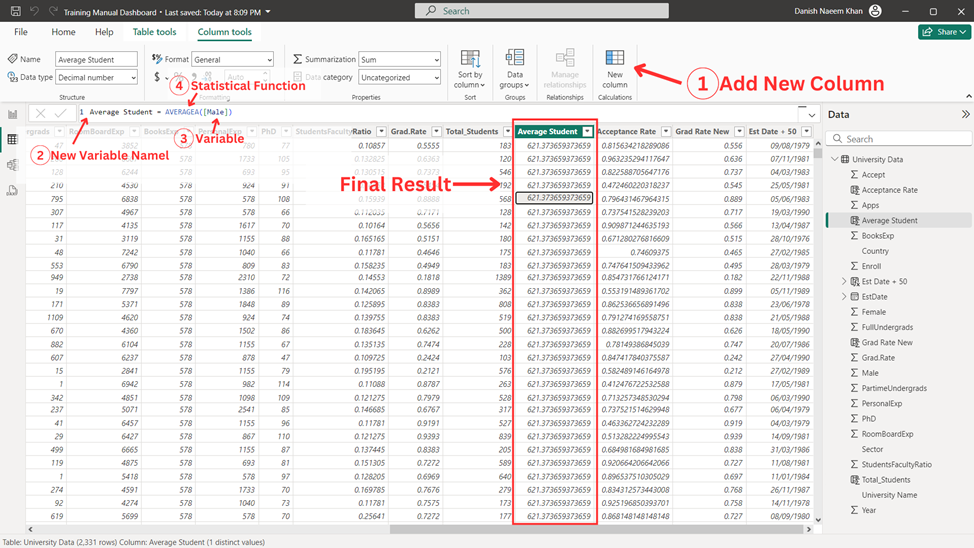
We can calculate the summary stats below with the help of a simple formula.
To calculate summary stats, follow the steps indicated below.
1. Add ‘New Column’.
2. Type new variable name.
3. Type the summary stat function you wish to calculate.
4. Type variable name.
5. Press enter.
In general the syntax looks something like this:
Mean
1 New Variable Name = AVERAGE([Variable Name])
Median
1 New Variable Name = MEDIAN([Variable Name])
Min
1 New Variable Name = MIN([Variable Name])
Max
1 New Variable Name = MAX([Variable Name])
Count
1 New Variable Name = COUNT([Variable Name])
Distinct Count
1 New Variable Name = DISTINCTCOUNT([Variable Name])
Ratios and Percentages
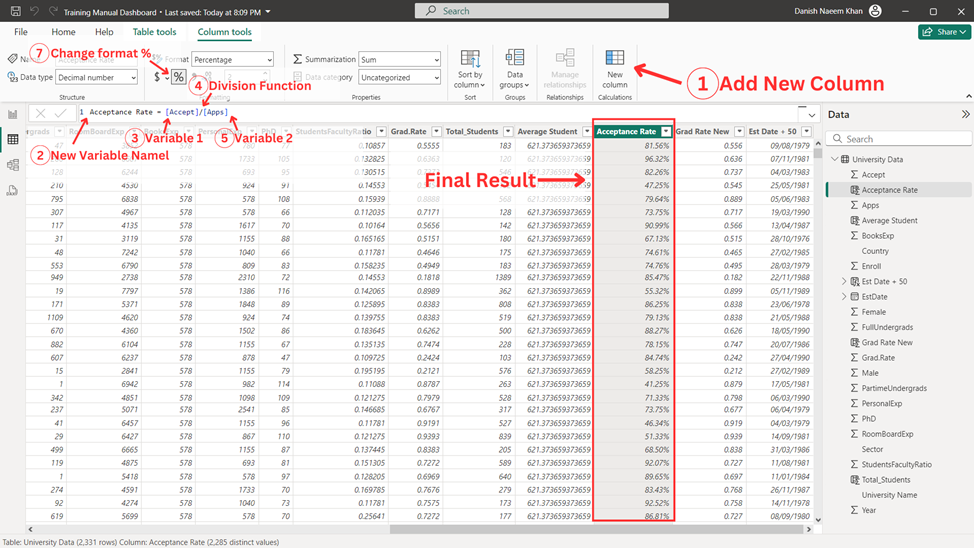
To calculate ratios/percentages, follow the steps indicated below.
1. Add ‘New Column’.
2. Type new variable name.
3. Type variable 1.
4. Type the division function (“/”).
5. Type variable 2.
6. Press enter.
7. Change the variable format to “%”.
In general the syntax looks something like this:
1 New Variable Name = [Variable 1]/[Variable 2]
Rounding-off Values
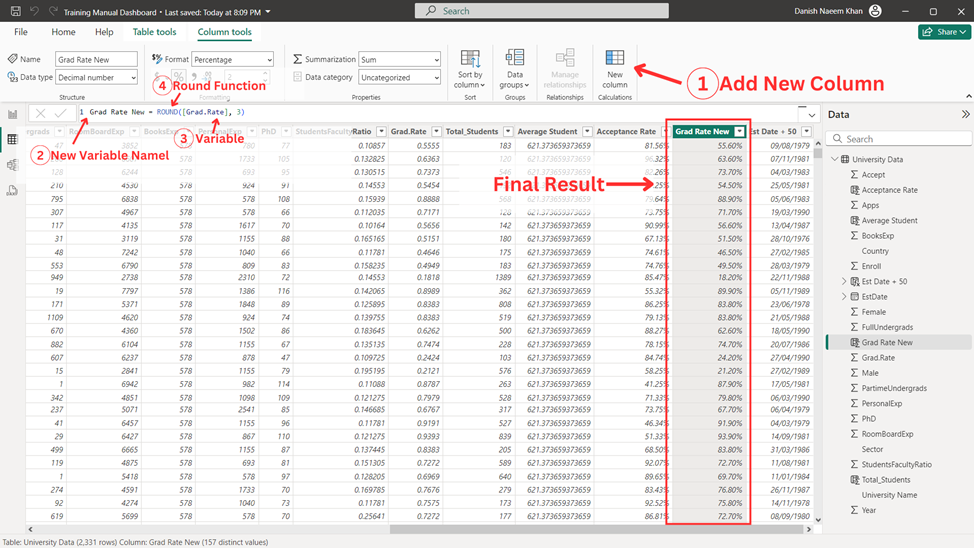
To calculate a new variable with rounded values, follow the steps indicated below.
1. Add ‘New Column’.
2. Type new variable name.
3. Type round function [ROUND()].
4. Type variable name.
5. Press enter.
In general, the syntax looks something like this:
1 New Variable Name = ROUND([Variable Name])
Date Functions
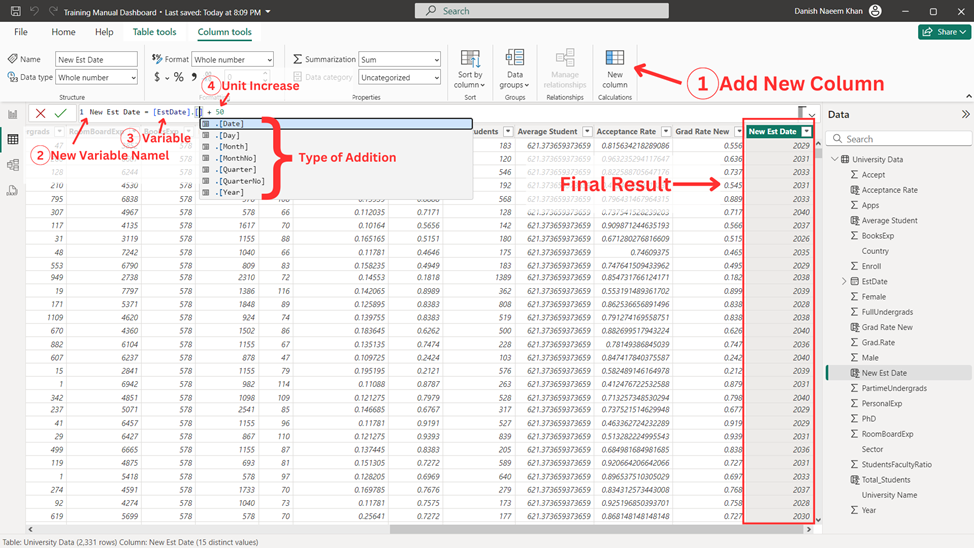
Addition in Date
To calculate addition in date, follow the steps indicated below.
1. Add ‘New Column’.
2. Type new variable name.
3. Type variable name followed by the type of addition you want to add (i.e. Day/Month/Year).
4. Type addition followed by the unit you wish to add.
5. Press enter.
In general the syntax looks something like this:
1 New Variable Name = [Date Variable].[Date] + Number
Difference in Date
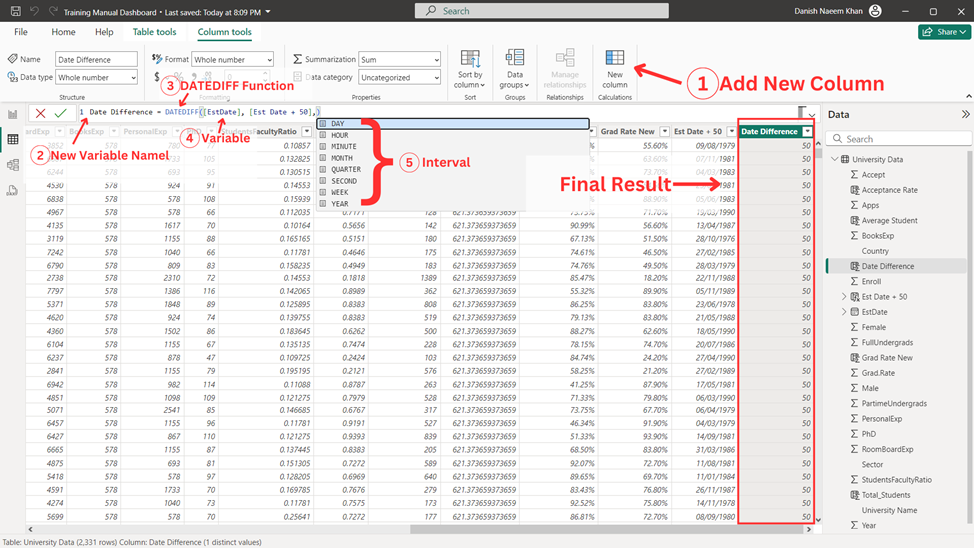
To calculate difference in dates, follow the steps indicated below.
1. Add ‘New Column’.
2. Type new variable name.
3. Type date difference function [DATEDIFF()].
4. Type variable names separated by commas.
5. Type the unit of difference you want (i.e. Day/Month/Year etc.).
6. Press enter.
In general the syntax looks something like this:
1 New Variable Name = DATEDIFF([Date 1],[Date 2],DAY)
1 New Variable Name = DATEDIFF([Date 1],[Date 2],MONTH)
1 New Variable Name = DATEDIFF([Date 1],[Date 2],YEAR)
IF Conditions
Single
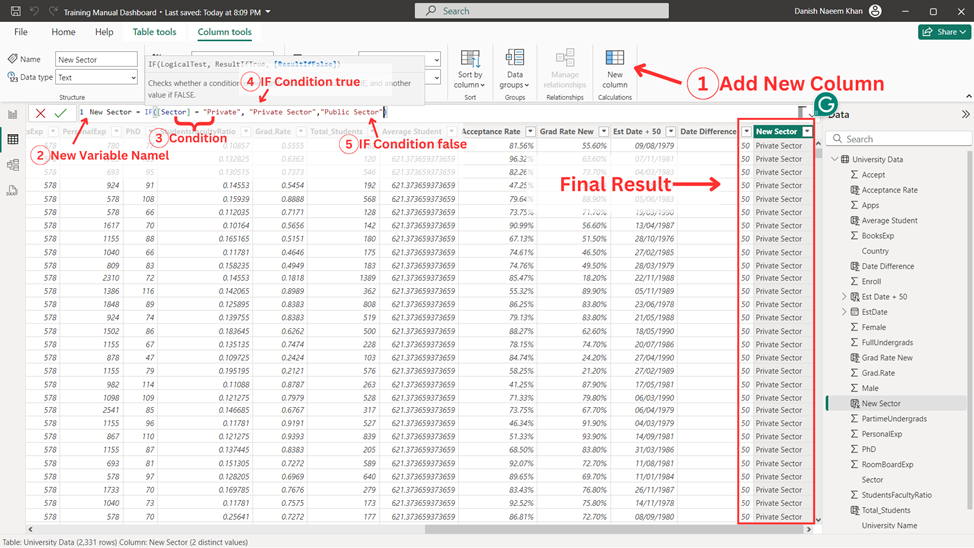
To calculate a new variable with single if condition, follow the steps indicated below.
1. Add ‘New Column’.
2. Type new variable name.
3. Start the condition with ‘IF()’ and add your condition.
4. Type what you wish to do if the condition is true.
5. Type what you wish to do if the condition is false.
6. Press enter.
In general, the syntax looks something like this:
1 New Variable Name = IF(Condition, Value if Condition is true, Value if Condition is false)
Nested
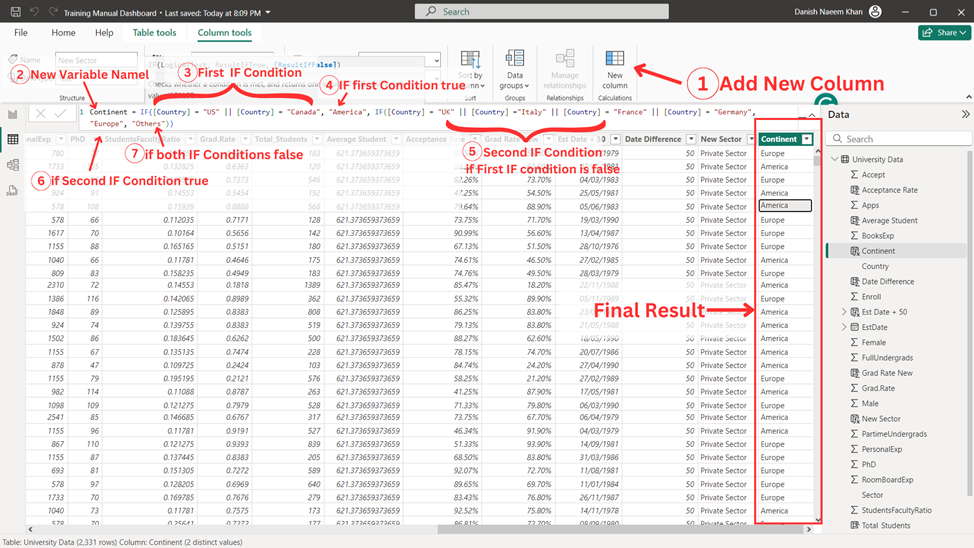
To calculate a new variable with nested if conditions, follow the steps indicated below.
1. Add ‘New Column’.
2. Type new variable name.
3. Start the condition with ‘IF()’ and add your condition.
4. Type what you wish to do if the first condition is true.
5. Start another condition with ‘IF()’ and add your condition. This indicates that if your first condition is not true then the second condition is applied.
6. Type what you wish to do if the second condition is true.
7. Type what you wish to do if both conditions are false.
8. Press enter.
In general the syntax looks something like this:
1 New Variable Name = IF( Condition 1, Value if Condition 1 is true, IF( Condition 2, Value if Condition 2 is true, Value if both Conditions are false))
Great job reaching this point in your Power BI journey! You've now mastered essential calculations, from arithmetic and summary statistics to date functions and conditional logic, all of which bring greater depth and precision to your analyses. In our final blog, we’ll explore data modeling and how to publish your Power BI dashboards. This last step will tie together everything you’ve learned, enabling you to create cohesive, interactive reports ready to share with your audience. Stay tuned and get ready to complete your Power BI skill set!

