A Beginner's Guide to Power BI (Part 1): Introduction to Power BI
Welcome to the starting point of your Power BI journey! This guide will walk you through the essentials of getting started with Power BI, including how to import and transform data to prepare it for analysis. You will also receive practical guidance on visualizing data effectively and applying filters to focus on specific insights. By following along, you will gain the foundational skills needed to create dynamic and interactive reports tailored to your needs.
What is Power BI?
Power BI is a robust business analytics tool from Microsoft designed to transform your data into interactive and insightful visualizations. By connecting to various data sources, Power BI enables you to create dynamic reports and dashboards that help you make informed decisions. With its user-friendly interface and seamless integration with other Microsoft products, Power BI makes it easy to analyze data, track performance, and share insights across your organization.
Power BI Interface
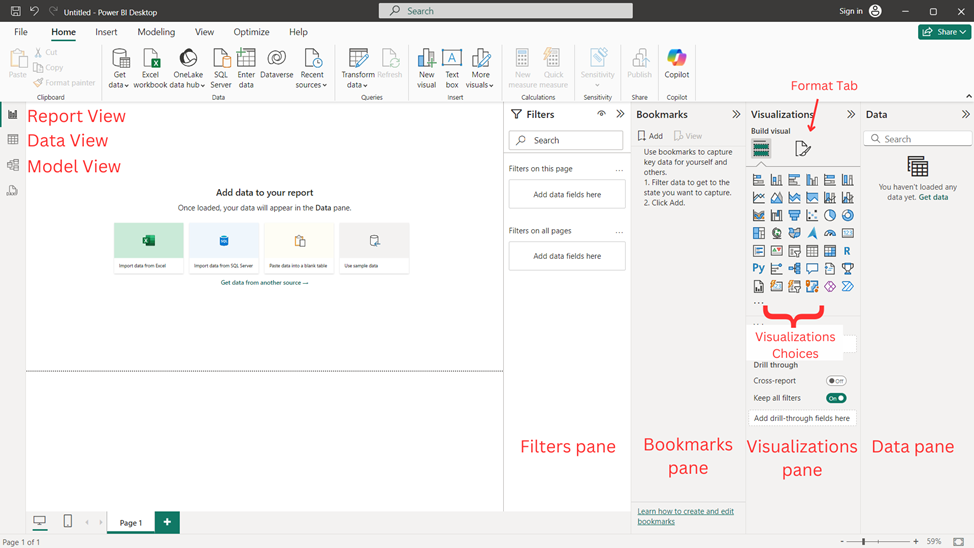
Before we start, it is essential to familiarize yourself with some common features of Power BI. When we open Power BI, the following interface appears with some of the key features as indicated below.
- report view
- data view
- model view
- Filters pane
- Bookmarks pane
- Visualization pane
- Visualization choices
- Format tab
Data pane
Importing data in Power BI
To import data from Excel in Power BI, you need to keep the following things in mind:
- The data should be clean and consistent.
- The data must be in Excel format.
- Read the data before loading in Power BI.
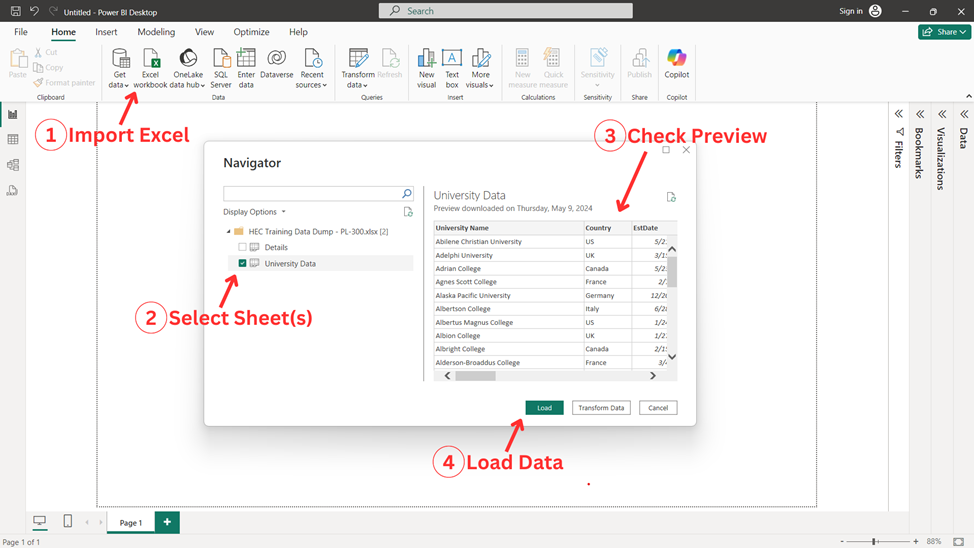
In order to import data in Power BI, you first click on the ‘Excel Workbook’ in ‘Data’ tab and select the excel workbook you wish to open. After this, the ‘Navigator’ tab opens which shows all the sheets available in the excel workbook. Select the desired workbooks you wish to open in Power BI and check the preview of the sheet. Once you verify the data in the preview tab, click on the ‘Load’ option. Visually, all these steps looks like figure below.
Transforming Data with Power Query
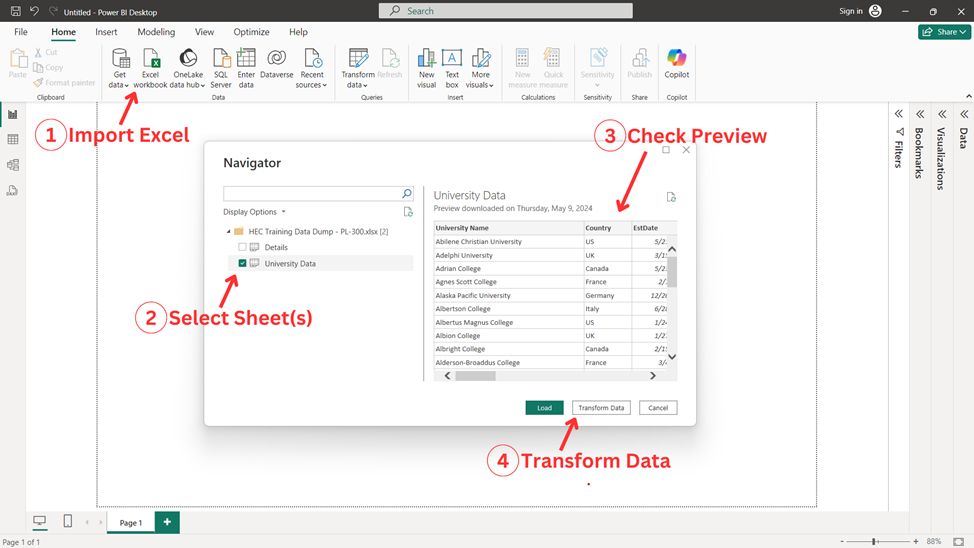
Sometimes, certain data cleaning / transformation is required in order to load data in the Power BI. In order to do this, you need to use the ‘Power Query’ in Power BI. First click on the ‘Excel Workbook’ in ‘Data’ tab and select the excel workbook you wish to open. After this, the ‘Navigator’ tab opens which shows all the sheets available in the excel workbook. Select the desired workbooks you wish to open in Power BI and check the preview of the sheet. Once you verify the data in the preview tab, click on the ‘Transform Data’ option.
Once you click on ‘Transform Data’, the following window of Power Query appears
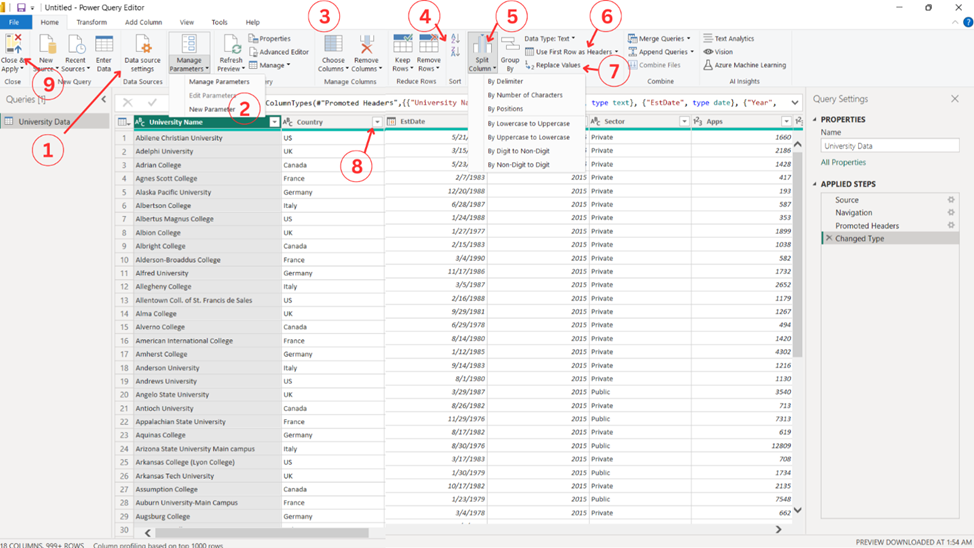
You can do various data transformation tasks in the power query editor some of which are listed below (indicated in figure below):
- Change Data Source: Here, you can change the data source of the file.
- New Parameter: Here, you create and manage values that can be reused throughout your queries.
- Choose Columns: Here, you can select which columns to load in the data.
- Sort: Here, you can sort the data as required.
- Split Column: Here, you can split columns based on various options.
- Use First Row as Headers: Here, you can select to use first row of the sheet as variable names or headers.
- Replace Values: Here, you can replace value based on your required transformation.
- Filter: Here, you can filter the data as required to be loaded as final data.
- Close & Apply: After completing all required transformations, choose this option to load the data.
General Instructions for Visualization in Power BI
There are a few key essentials that should be kept in mind while making a Power BI dashboard.
Canvas Area
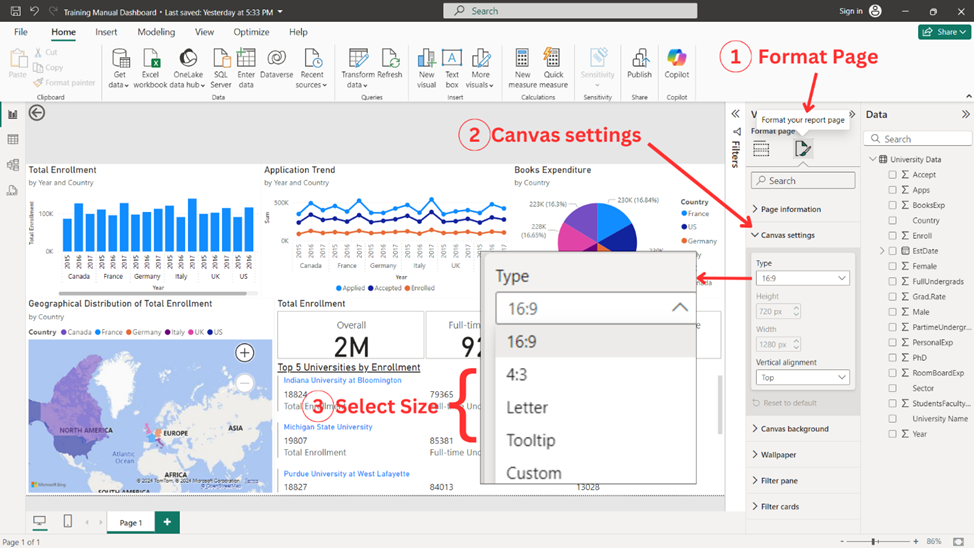
Canvas area is defined as the total area where visuals are to be placed on a dashboard. Canvas area is a crucial step in making dashboard. This can be adjusted as per the requirements of the dashboard. In order to customize the canvas area,
- Select ‘Format page’ from the ‘Visualizations pane’.
- Select ‘Canvas Settings’.
- Select ‘Type’ and select the desired area of the canvas.
Visuals Placement
Visuals placement is also a very crucial step towards designing a dashboard. While designing a dashboard, it is important to consider the ‘total area of the canvas’, ‘size of the visuals’, and ‘placement of the visuals’. To visually understand this, an example is demonstrated between a good and a bad placement of visuals in figure below.

Filters
Some visualizations requires filters in order to refine the required outcome. In order to add filters to your visualization,
- Select the visualization you wish to make from the ‘Visualizations pane’.
- Add fields to the visualization.
- Select the field you wish to add filter to from the ‘Filters pane’
- Select the type of filter you wish to add to your filed in the visualization.
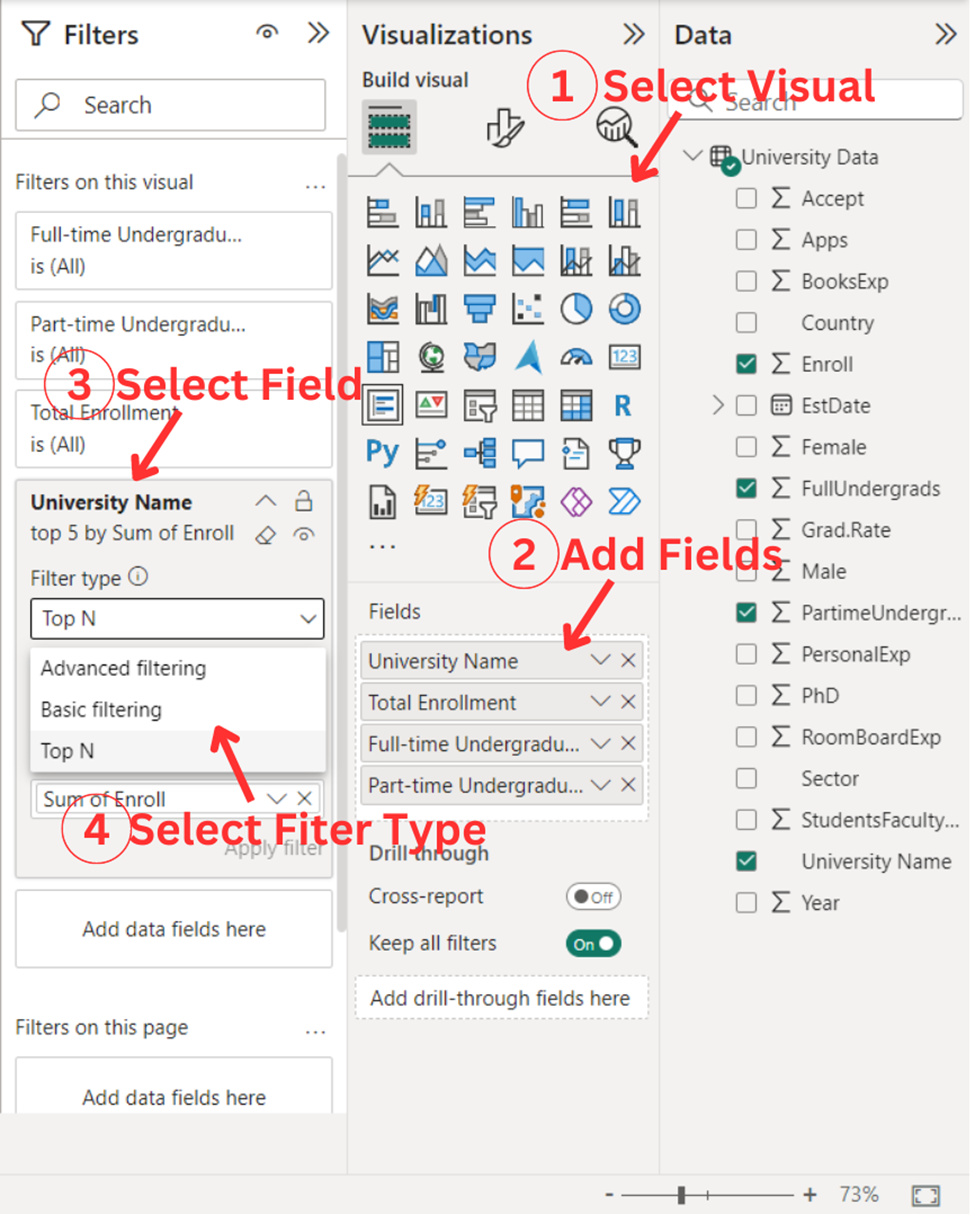
There are three types of filters that you can apply to your visualization.
- Advanced Filtering: In this type of filtering, you can filter based on the conditions below.
• Contains
• Does not contain
• Starts with
• Does not starts with
• Is
• Is not
• Is blank
• Is not blank
• Is empty
• Is not empty - Basic Filtering: In this type of filtering, you can filter based on the observations in a field.
- Top N: In this type of filtering, you can filter based on ‘top’ or ‘bottom’ Nth observations in a field.
Congratulations on completing the first part of your Power BI journey! By now, you should have a good grasp of how to import, transform, and prepare data for analysis, as well as some basics on data visualization and filtering. In the next blog, we’ll dive deeper into enhancing your reports by adding visuals, tables, buttons, navigators, and slicers. These elements will bring greater interactivity and insight to your dashboards, helping you communicate data stories more effectively. Stay tuned for the next steps as we continue to build your Power BI expertise!

