
Data Cleaning - An Important Step of the Data Analysis Cycle
In the world of data science and analytics, data cleaning is the unsung hero. While it may not be the most glamorous part of the process, it is arguably one of the most critical. No matter how sophisticated your algorithms are or how insightful your analysis, the results of your work will only be as good as the data you start with. In this blog, we will explore the essential protocols for data cleaning to ensure your analysis is built on a solid foundation.
I will use Stata to analyze data in this blog post. Readers’ beginner to intermediate level knowledge of Stata is assumed.
Why Data Cleaning Matters?
Data cleaning is the process of identifying and correcting errors or inconsistencies in your dataset to improve its quality. This step is crucial because poor data quality can lead to inaccurate insights, faulty models, and ultimately, misguided decisions. Common issues found in raw data include missing values, duplicates, outliers, and inconsistent formats, all of which can skew your results, if not properly addressed.
Understanding Your Dataset
Before diving into the cleaning process, it is vital to familiarize yourself with your dataset. Understanding the context in which the data was collected, its structure, and its source can help you identify potential issues early on. An initial exploratory analysis—using summary statistics and visualizations—can reveal patterns, anomalies, and other aspects that need attention.
For this blog, I will use the fictional dataset shown below:
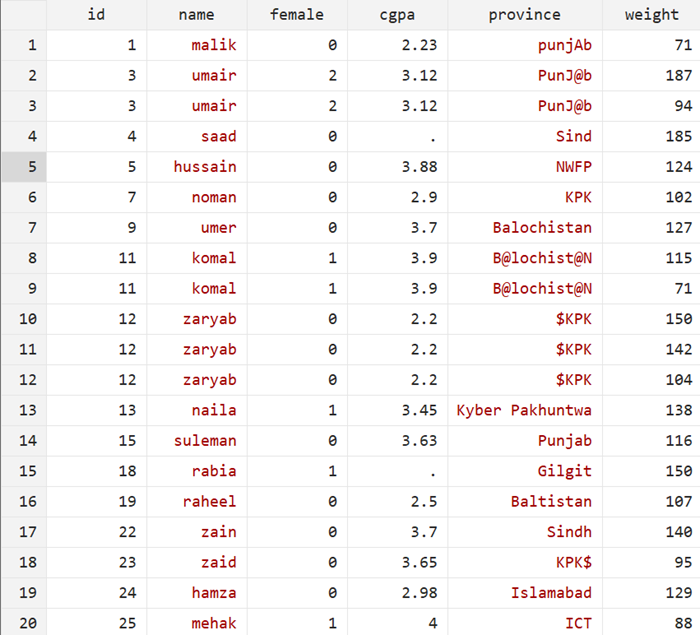
What will happen if you start analyzing this data without cleaning it? See basic summary statistics below:
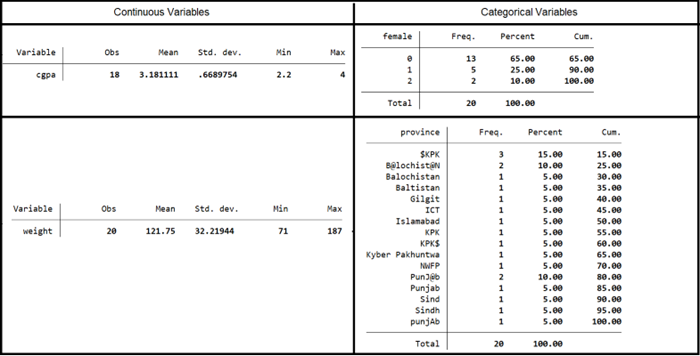
Interpretation:
If we draw insights from this data, we see that the average CGPA of students is 3.18 . The average weight of students is 121.75 kg (which seems quite high for an average.).
The dummy variable, female, is 1 if the student is female, and 0 if they are male. So, the data shows that there are 5 females and 13 males. The number 2 does not make sense in this variable.
Further, if we tabulate the origin of students, we see lot of varying names for the same provinces in the dataset. Do you observe other issues?
As pointed out above, there are many inconsistencies in this dataset that need to be resolved before it can provide meaningful insights.
To remove these inconsistencies, I will demonstrate how to clean this dataset. I will also highlight some useful points while cleaning it.
Handling Missing Data
Missing data is a common problem; and how you address it can significantly impact your analysis. In our case if you see the variable, cgpa, you will see there are some missing values. You can confirm it yourself by doing the following in Stata:
count if cgpa == .
There are a few options to deal with missing data:
1) Imputation: Filling in missing values based on other data (mean, median, mode, or more sophisticated methods). Simple imputation will look like this:
summ cgpa replace cgpa = `r(mean)' if cgpa == .
2) Deletion: Removing rows or columns with missing data, which can be effective but risky if too much data is lost. For instance, missing observations in the dataset can be dropped using the following:
drop if cgpa == .
3) Algorithmic Handling: Using models that can manage missing data without needing explicit imputation. An example is using the regression model for imputing missing values (I will write more about this in a separate blog).
Dealing with Duplicates
Duplicate entries can distort your analysis, making it essential to identify and remove them. Tools like Pandas in Python provide straightforward methods to detect duplicates, ensuring your dataset remains accurate and relevant.
To find duplicates in your dataset, you need to understand the unit of observation first. For instance, if you look at our fictional dataset, it is student level which means that student information must not repeat in more than one row. This suggests that the unique identifier in the dataset must be student ID (variable: id). In Stata, we can check duplicates in this variable in the following way:
duplicates report id
The above command will show us the duplicates (if there are any). After determining the nature of duplicates, you may decide to drop them. One brute way is to do the following:
duplicates drop id, force
Given there were duplicates in our dataset, we can now see how the summary statistics presented above were misleading.
Outlier Detection and Treatment
Outliers can sometimes provide valuable insights, but they can also skew results. Techniques like Z-scores or the Interquartile Range (IQR) method can help you identify outliers. Once detected, you can decide whether to keep, transform, or remove them based on the context.
For instance, if you see the variable, weight, you will find that the average weight is not correct. If you are not given any questionnaire, it is better to ask the data curator about the nature of variables.
Consistency Checks
Ensuring data consistency is about making sure that the data types, formats, and coding schemes are uniform across your dataset. This might involve converting dates to a standard format, aligning categories, or ensuring numerical data is in the same unit of measurement.
Data Normalization and Standardization
Data normalization and standardization are critical for ensuring that your variables are on a comparable scale. This step is especially important in machine learning, where the range of data can impact model performance. For instance, see the variables, province and weight : they must be corrected before starting any analysis (Figure 2).
Documenting the Process
A well-documented data cleaning process is invaluable. Keep a detailed log of every cleaning step you take—this serves not only as a reference but also as an audit trail. Additionally, using version control systems like Git or saving in Cloud (OneDrive, GoogleCloud, Dropbox, etc.) can help you track changes and revert to previous versions if necessary.
Best Practices and Common Pitfalls
Best Practices:
Validate Cleaning Steps: Always perform checks after cleaning to ensure that the issues have been resolved correctly.
Consult Stakeholders: Ensure your cleaning decisions align with the needs and expectations of those who will use the data.
Common Pitfalls:
Over-Cleaning: Removing too much data can strip away valuable information.
Under-Cleaning: Leaving errors in the data can compromise your entire analysis.
Ethical Considerations
Maintaining data integrity is a key ethical responsibility. Altering data without proper justification can lead to biased or incorrect outcomes. It is crucial to ensure that your cleaning process preserves the true nature of the data and that any adjustments made are well-documented and justified.
Conclusion
Data cleaning may not always be the most exciting part of data analysis, but it is an indispensable step that directly impacts the quality of your results. By following these protocols—understanding your data, handling issues methodically, automating where possible, and documenting your process—you can ensure that your analysis is built on a solid, reliable foundation. Remember, clean data leads to clear insights, and clear insights drive better decisions.

The author works part-time with OPE as a Research Associate. He is a PhD Economics candidate at the University of Delaware.